Is there really an "Epidemic" of "Traffic Violence?," Part II
Looking at the 1994 to 2021 FARS Dataset Categorized by Road User Type
Note 1: This is Part II of a multi part series examining the question of whether there is an “epidemic” of “traffic violence.” As with Part I, post is long and contains several charts making it difficult to view in an email client or on a mobile device so viewing on a larger screen using a web browser will likely result in best viewing.
Note 2: The author made a formula error with the 80th and 95th percentile for the fatalities per 100k people, this error has been corrected but does not change the end results. 1
Part I of “Is there really an "Epidemic" of "Traffic Violence?," located here, introduced Darrel Huff's famous book "How to Lie with Statistics," which explores the misuse of statistical data to mislead the public. It was later revealed that Huff was involved with the tobacco industry lawyers in their effort to mislead the public by using the very things he warned against in his best selling book.
Then there was a dive into the idea of "concept creep," as introduced by psychologist Nick Haslam. It explains how the meanings of terms such as "trauma" and "violence" have expanded over time, leading to broader and sometimes misleading interpretations due. Here, the term "traffic violence" was introduced to describe traffic incidents as described by “safe streets” activists, arguing that it distorts the original concept of violence akin to concept creep. These “safe streets” activists often boldly assert radical “solutions” to the problems they believe they’re working to solve and adopt an oppressor/oppressor narrative labeling “drivers” (motor vehicle drivers) as the former and “vulnerable road users” such as bicyclists and pedestrians as the Noble Victims. It was also argued the term “epidemic,” experienced a similar change in meaning to fit activist-driven narratives. Calling traffic accidents or collisions “traffic violence” and phenomena an “epidemic” were both cited examples of how activists and media use alarming language to describe traffic incidents, often without proper context or statistical backing.
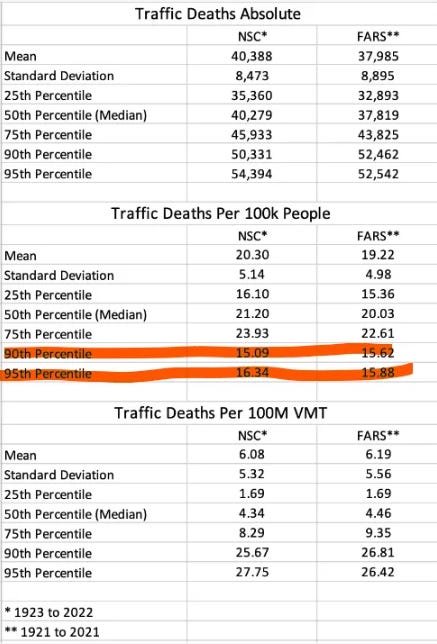
The rest of the piece aimed to try to explore the question of whether there was an “epidemic” of “traffic violence,” at least in the context of traffic fatalities in the United States using actual fatality data from two sources, the National Highway Traffic Safety Administration’s FARS data and the National Safety Council (NSC) data. The effort compared historical traffic fatality rates going back into the 1920s with current data, examining whether the change in fatalities in absolute fatalities, in fatalities per 100k population, and in fatalities per 100 Million Vehicle Miles Traveled (VMT) can be considered an “epidemic.” The piece proposed several “epidemic baselines” or “thresholds” in the style of ‘s “The Gun Homicide Epidemic Isn’t” piece.
Included were the mean, 50th percentile, 75th percentile, 90th percentile, and 95th percentile for change in fatalities in absolute terms, in fatalities per 100k population, and in fatalities per 100 Million Vehicle Miles Traveled (VMT). The processes were applied to both FARS and NSC datasets for the years 2018 to 2021 - all of which are years activists claimed experienced “epidemics,” of “traffic violence.” Part I also discussed how activist often use only absolute figures often without context to scaremonger. Adding fatalities per 100k people and fatalities per 100M VMT provide additional needed context.
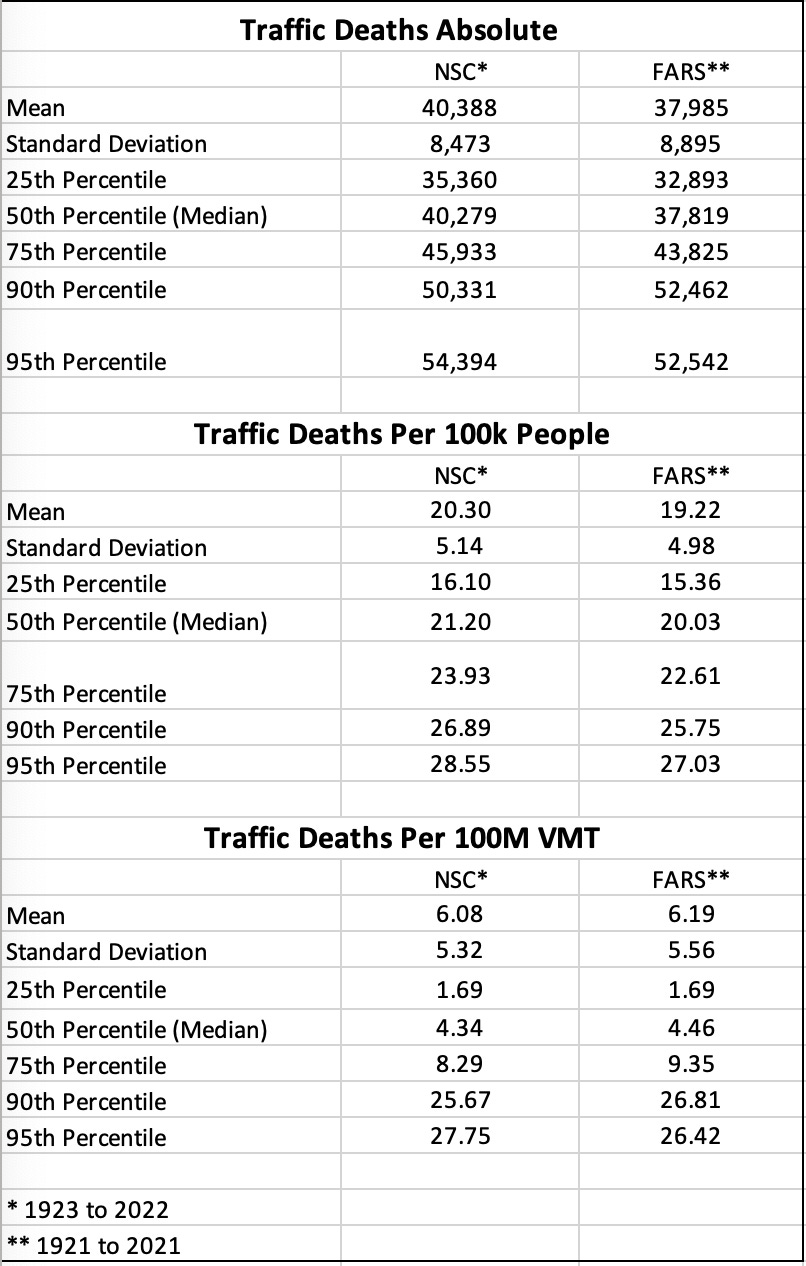
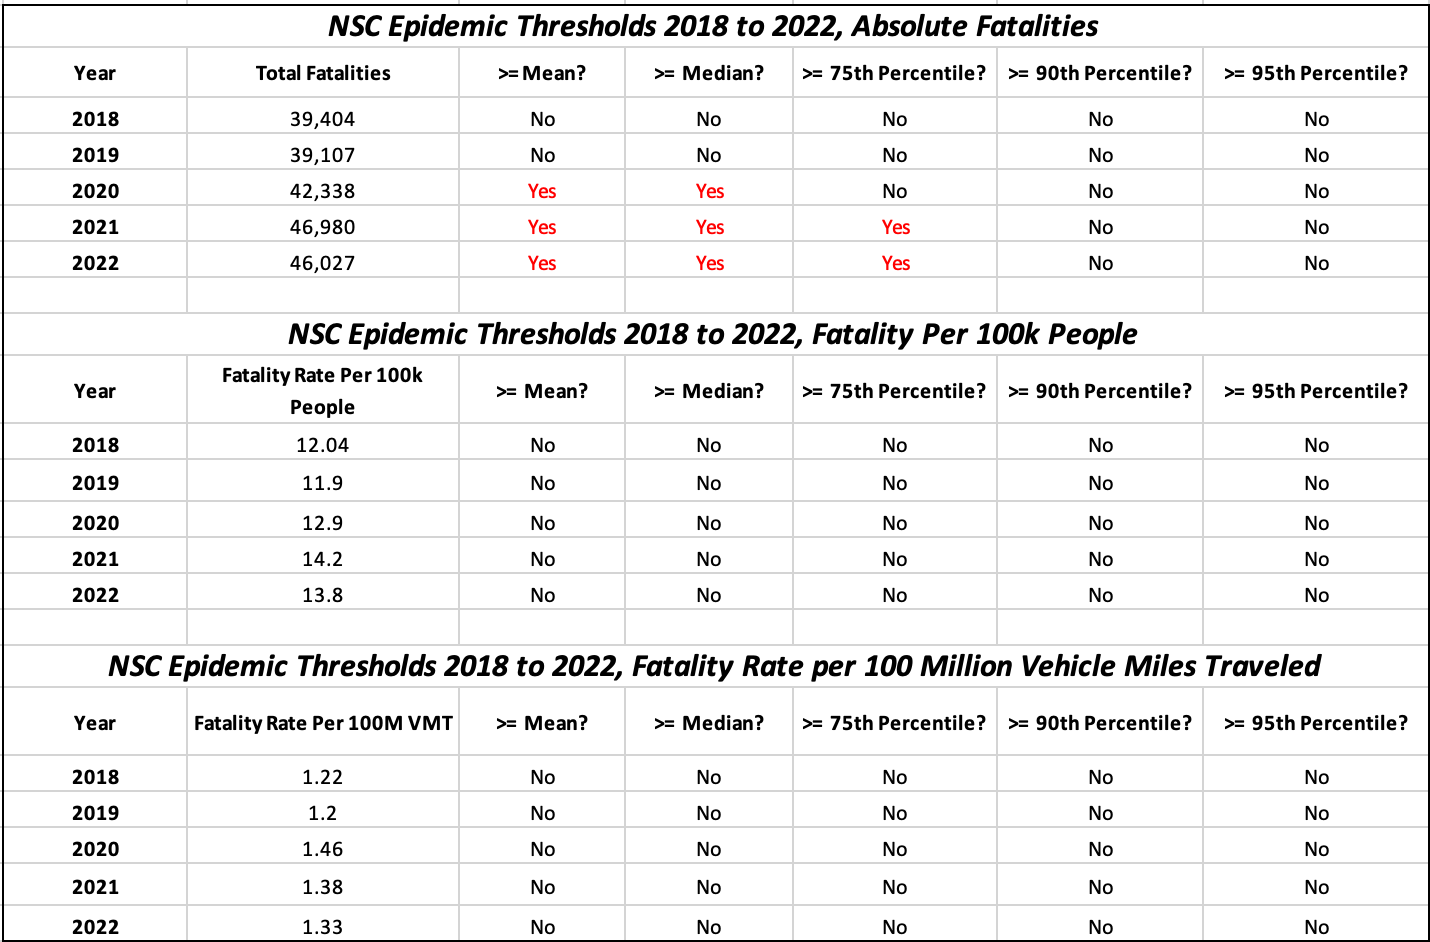
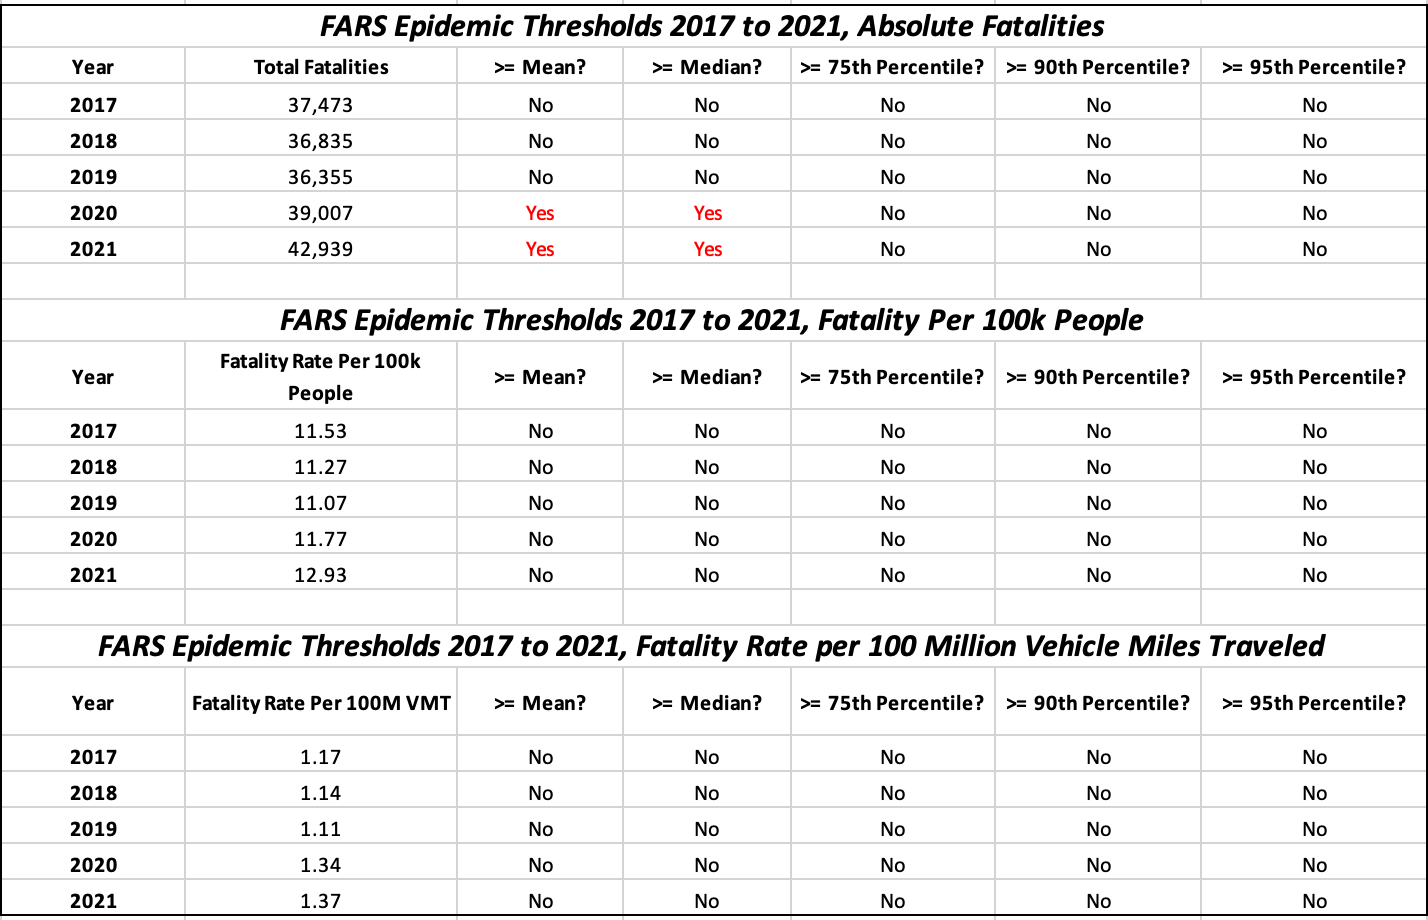
Part I’s tables are repeated below.
These tables really put the “epidemic”claim to shame.
At worst, 2021 and 2022 were years of concern, and the verdict is still out on whether there’s any meaningful trend leaning towards a potential actual epidemic in the future.
That’s at least on the ultra low resolution national level.
Towards the end, the piece suggested further studies to focus on different geographical regions, different types of road users, and including serious injuries on top of fatalities as further rabbit holes for analysis.
This piece intends to go down at least one of these paths.
Here we will look into a specific dataset from NSTSA’s FARs which provide a breakdown of deaths by road user.
These FARS data have divided these fatalities into the following user types:
Motor Vehicle Occupant (this includes the driver and passengers)
Motorcyclist
Pedestrian
Bicyclist
Other/Unknown
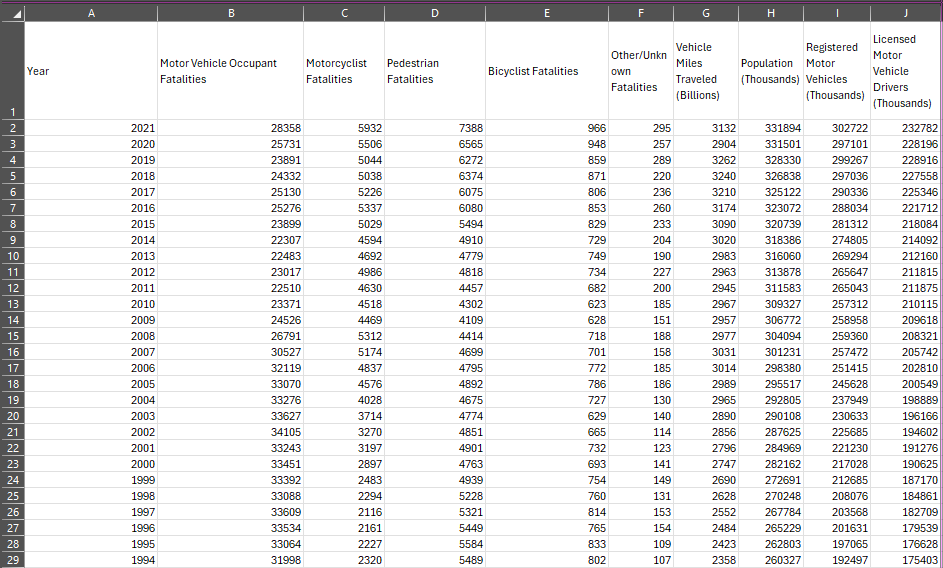
The FARS and NSC datasets in Part I went back around a century, but this FARS dataset only spans from 1994 to 2021. Needless to say it can be used to try to answer a slightly different question: whether there’s an “epidemic” of “traffic violence” fatalities2 of a certain road user type using similar “thresholds” or “baselines” from Part I.
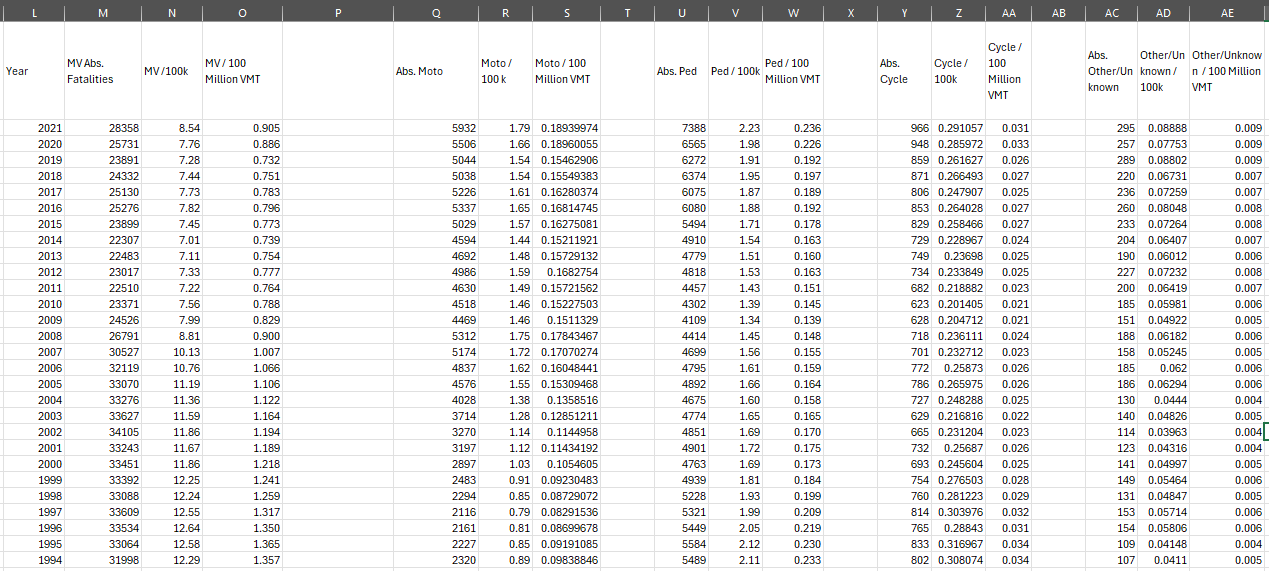
To get started, below is a “cleaned up”3 version of the 1994 to 2021 FARs data table.
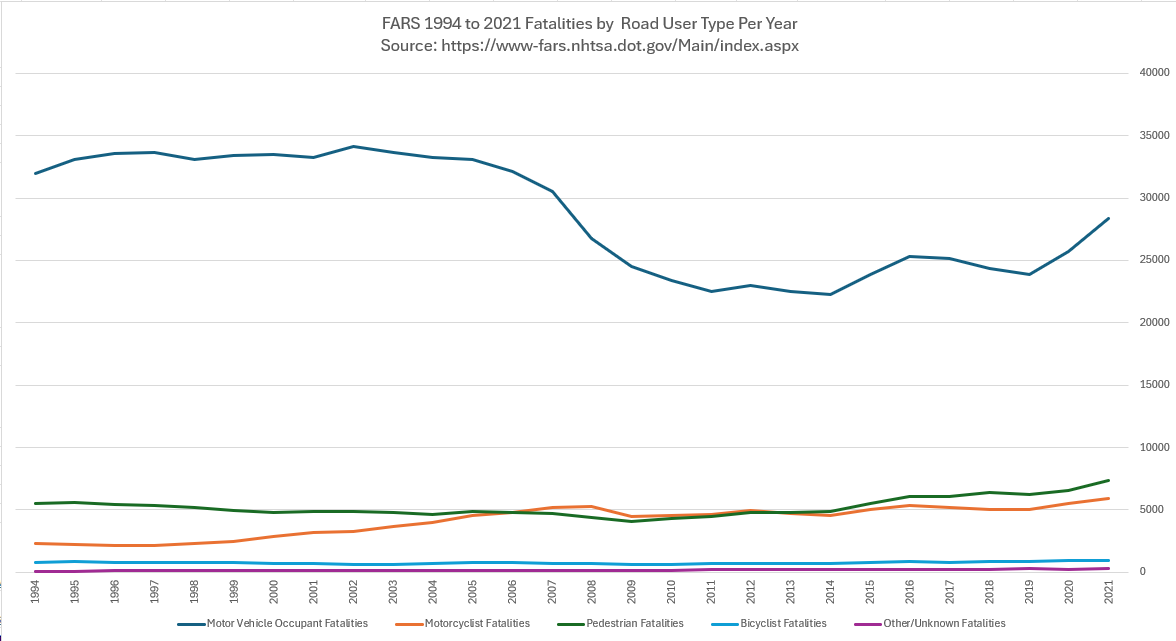
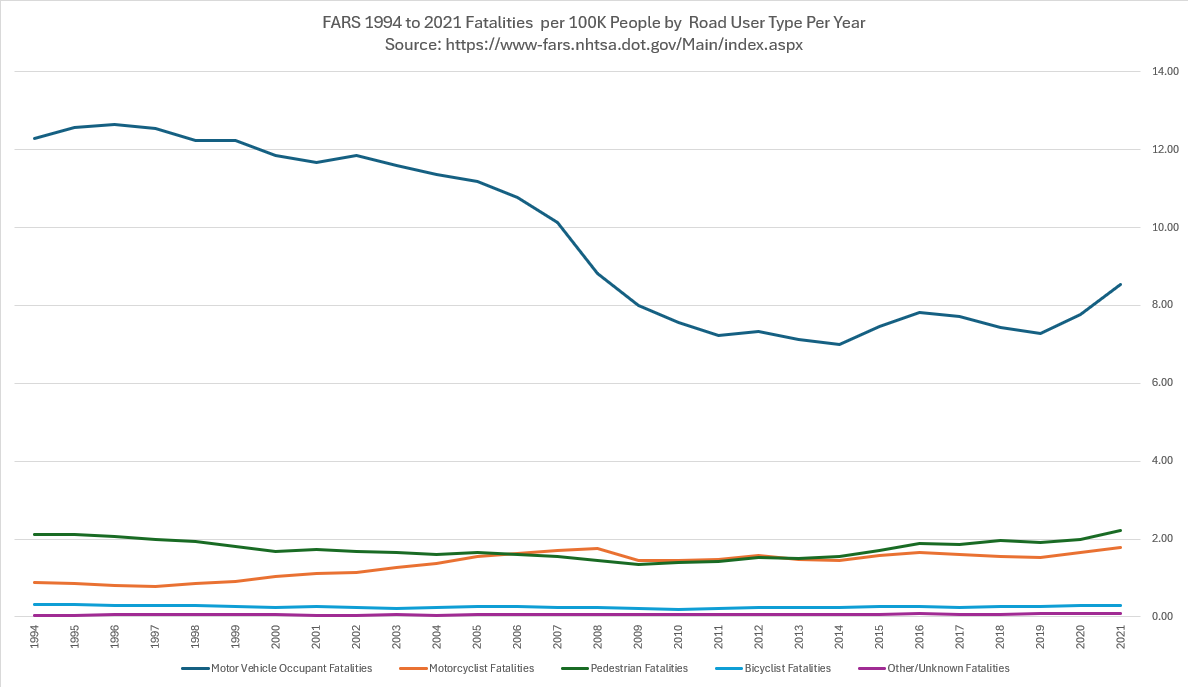
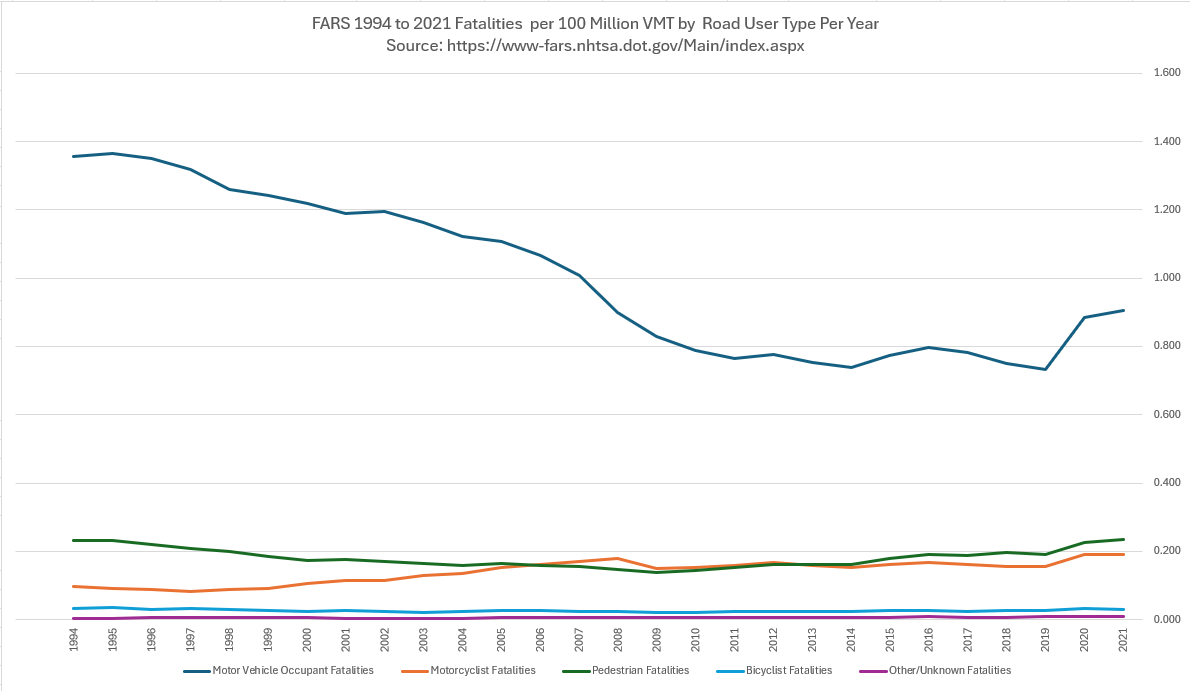
It was then possible to split each road user and calculate fatality rates per 100M VMT and fatality rates per 100K population.
Then, Total Fatalities:
Fatalities per 100k people:
Fatalities per 100 Million VMT:
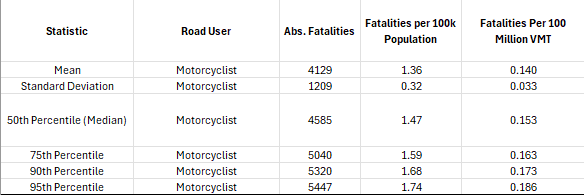
Then the same statistics4 were calculated as in Part I, but this time divided into each road user.
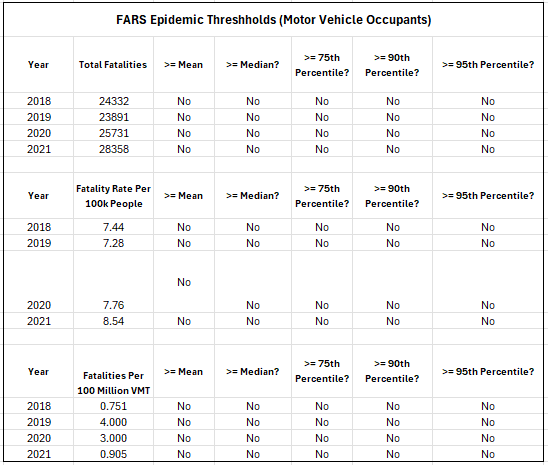
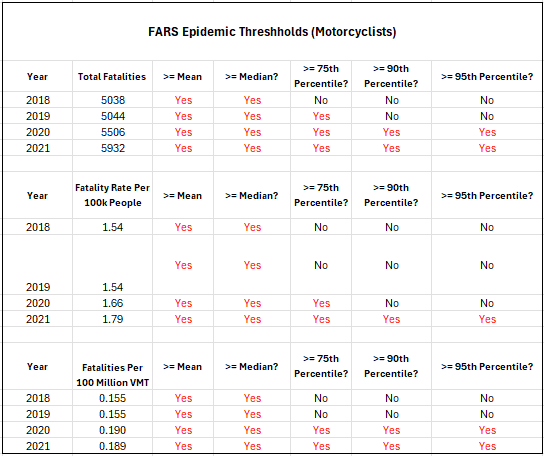
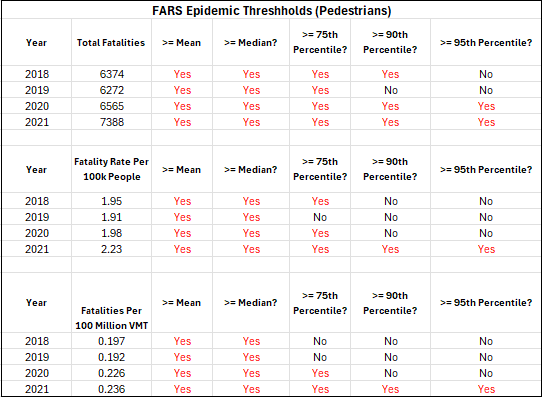
Then the absolute/total fatalities, fatality rate per 100k people, and fatality rate per 100M VMT for each road user type were extracted from 2018 to 2021 and compared to the statistics to see whether they met or exceeded each baseline/threshold.
Motorists and motor vehicle occupants did not meet or exceed any of the epidemic thresholds which to review were really whether the 90th and 95th percentiles were met or exceeded.
Things however were completely different for motorcyclists with especially the years 2020 and 2021 triggering most, if not all the thresholds including what we’re considering there to be “epidemic.”
Motorcycling gets little attention from “safe streets” activists and that’s a shame because many safe and defensive driving principles in motorcycles apply to bicycling (which would eliminate most of the advocacy for “protected bike lanes” over in bicycle space) Motorcycles are also super fun to ride, emit low emissions, and can be used to cover travel needs competitive with cars but that may be not practical for bicycling. As for the “epidemic” label, a paper from 1967 referred to motorcycle crashes as an “epidemic,” and in recent years, the narrative is out there about such a label describing motorcycling fatalities. This is another potential rabbit hole that may be worth exploring in a future piece.
Pedestrians did not fare too well either. Streetsblog’s Angie Schmitt who wrote the book “Right of Way: Race, Class, and the Silent Epidemic of Pedestrian Deaths in America, might be onto something. (A review of her book will also be published here in the future.) “Safe streets” activists, which includes Schmitt , of course often completely blame “oppressor” drivers for this issue and not any other possible variable such as decreased enforcement of traffic laws, drunk, distracted, or invisible pedestrians of which mentioning is typically called “victim-blaming,” because in this world pedestrians (or as they call then “people walking”) are protected Noble Victims. Pedestrian fatalities are needless to say a rabbit hole worth digging into in a future piece.
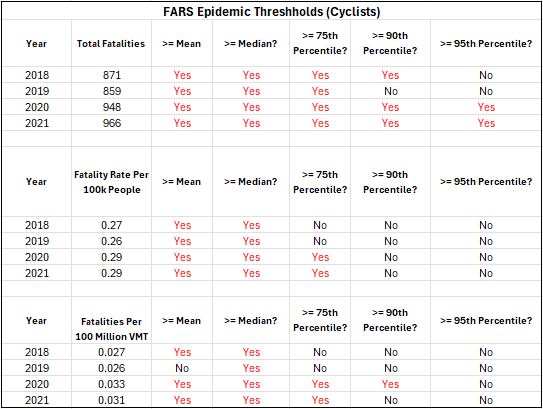
Next, and of course the main interest of Principled Bicycling are cyclists. Here things look relatively bad too, but not motorcyclist-level bad or pedestrian-level bad. Two possible hypothesis aside from the “dRiVeRs KiLl PeOplE” narrative of the “safe streets” activists, Platitude-driven bicycling advocates and Cluster B(ike) activists is (1) the COVID “bike boom” resulting in millions of new, yet unexperienced and likely unsafe bicyclists, (2) the rise of e-bikes, and (3) the cancerous spread of “protected” bike lanes in cities such as New York City, San Francisco, Portland, San Diego5, and Denver to name a few6. It should also be noted that not all bicycling fatalities are counted here for as FARS criteria only count fatalities with a bicyclist and a “motor vehicle in transport.7” Heaps of rabbit holes exist here, too.
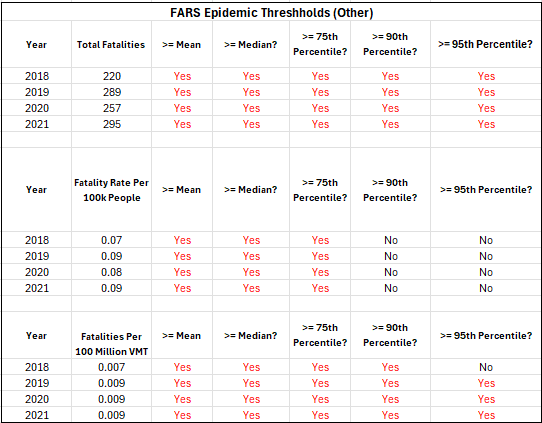
Lastly, there’s the catch all “other” or “unknown” category which end up being almost a rounding error when added up against the total fatality figures but is included here just to ensure everything adds up.
There’s quite a bit of handwaving about electric app-based rental scooters which are sometimes defined as vehicles, but not motor vehicles, and oftentimes defined as “devices.” Rental services such as Bird and Lime emerged in the late 2010s and perhaps fatalities involving these get included in this obscure “leftover” category.
In conclusion the dive into this data set, while encompassing roughly a quarter century of fatalities paints an entirely different picture than what was looked at in Part I. Motor vehicle occupants, likely with safer vehicle features such as seat belts, infant and young child car seats, and obviously a protective cage to name a few don’t come close to “epidemic” status unlike other road users. Several “verdicts” still remain such as primary collision factors, issues with how fatalities make it into FARS in the first place, day versus night, urban versus rural, etc.
Upcoming pieces will attempt to look into these various paths down the rabbit hole including looking at other countries and zooming in on individual cities or states in the United States.
The activist definition of “traffic violence,” typically includes both deaths and serious injuries, but the data for Part I was limited to fatalities only and Part II will also only focus on fatalities. Future parts of this series will attempt to look at serious injuries.
If readers are interested in the author’s spreadsheet files for this part or back in Part I, let me know in the comments and I’ll figure out a way to get them to you.
This piece accidentally excluded the 25th percentile figures.
Several formerly safe roads in San Diego and surrounding cities were ruined by the installation of “protection.”
Downtown Denver’s segregated cycletrap “network” has become virtually unusable for safe cycling.
See Paul Schimek’s paper “Bike lanes next to on-street parallel parking” or his article “Where Bike Lane Design Collides with Savvy Cycling.”

