Last March, the San Diego County Bicycle Coalition claimed via a tweet that “300 cyclists and pedestrians were killed on the streets of San Diego between 2014 and 2021.”
Just this passed week, Circulate San Diego NYC, along with the local chapter of Families for Safe Streets, hosted an event at the San Diego City Hall to “to honor 283 pedestrians and cyclists who were killed in traffic crashes in San Diego County in 2022.”
Both these figures are wrong.
This stuff isn’t terribly difficult to verify either, and for those who went ahead and clicked on those links above, this isn’t the first time their flawed figures have been corrected. But X isn’t the best place to argue details and nuance so let’s dig in a bit deeper here.
Traffic fatalities are almost always recorded into the state’s Statewide Integrated Traffic Records System or SWITRS, a database maintained by the California Highway Patrol (CHP). The “almost always” clause is included here because sometimes a person may die days or weeks after the report is completed.
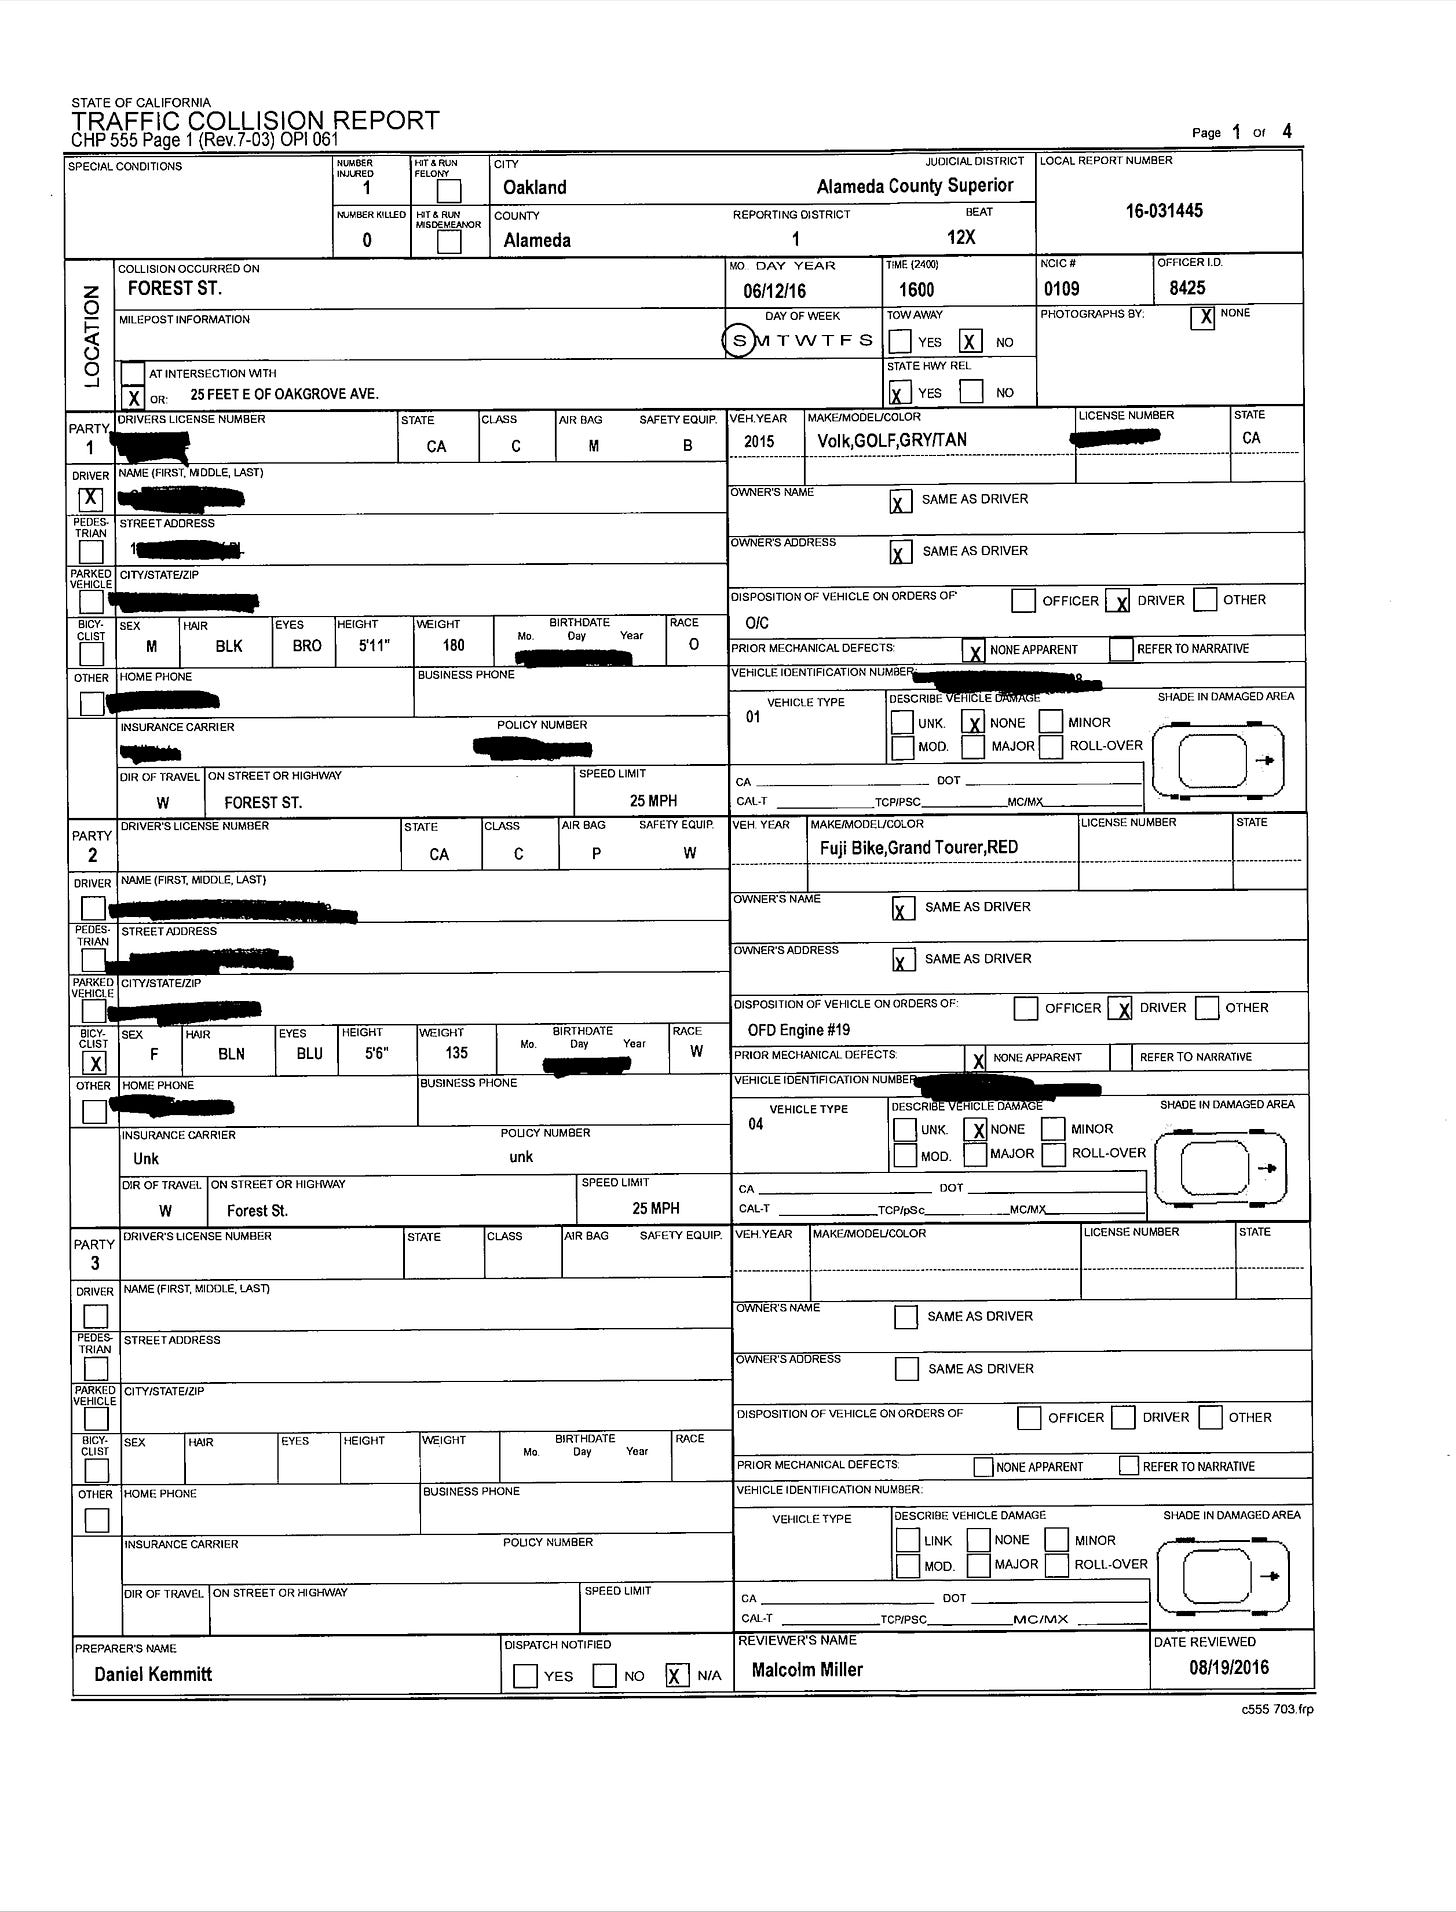
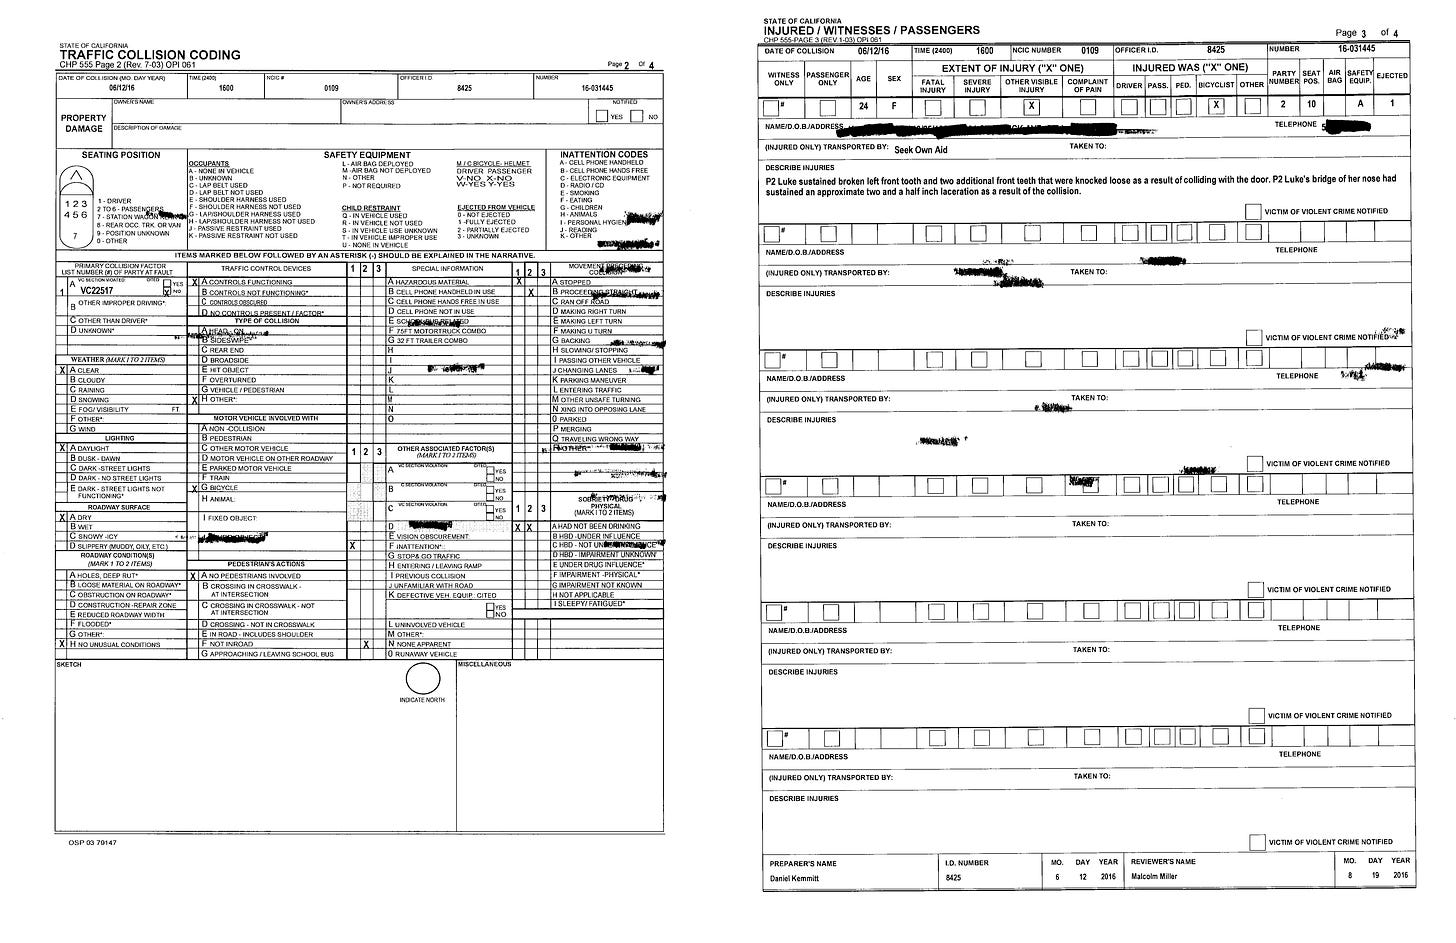
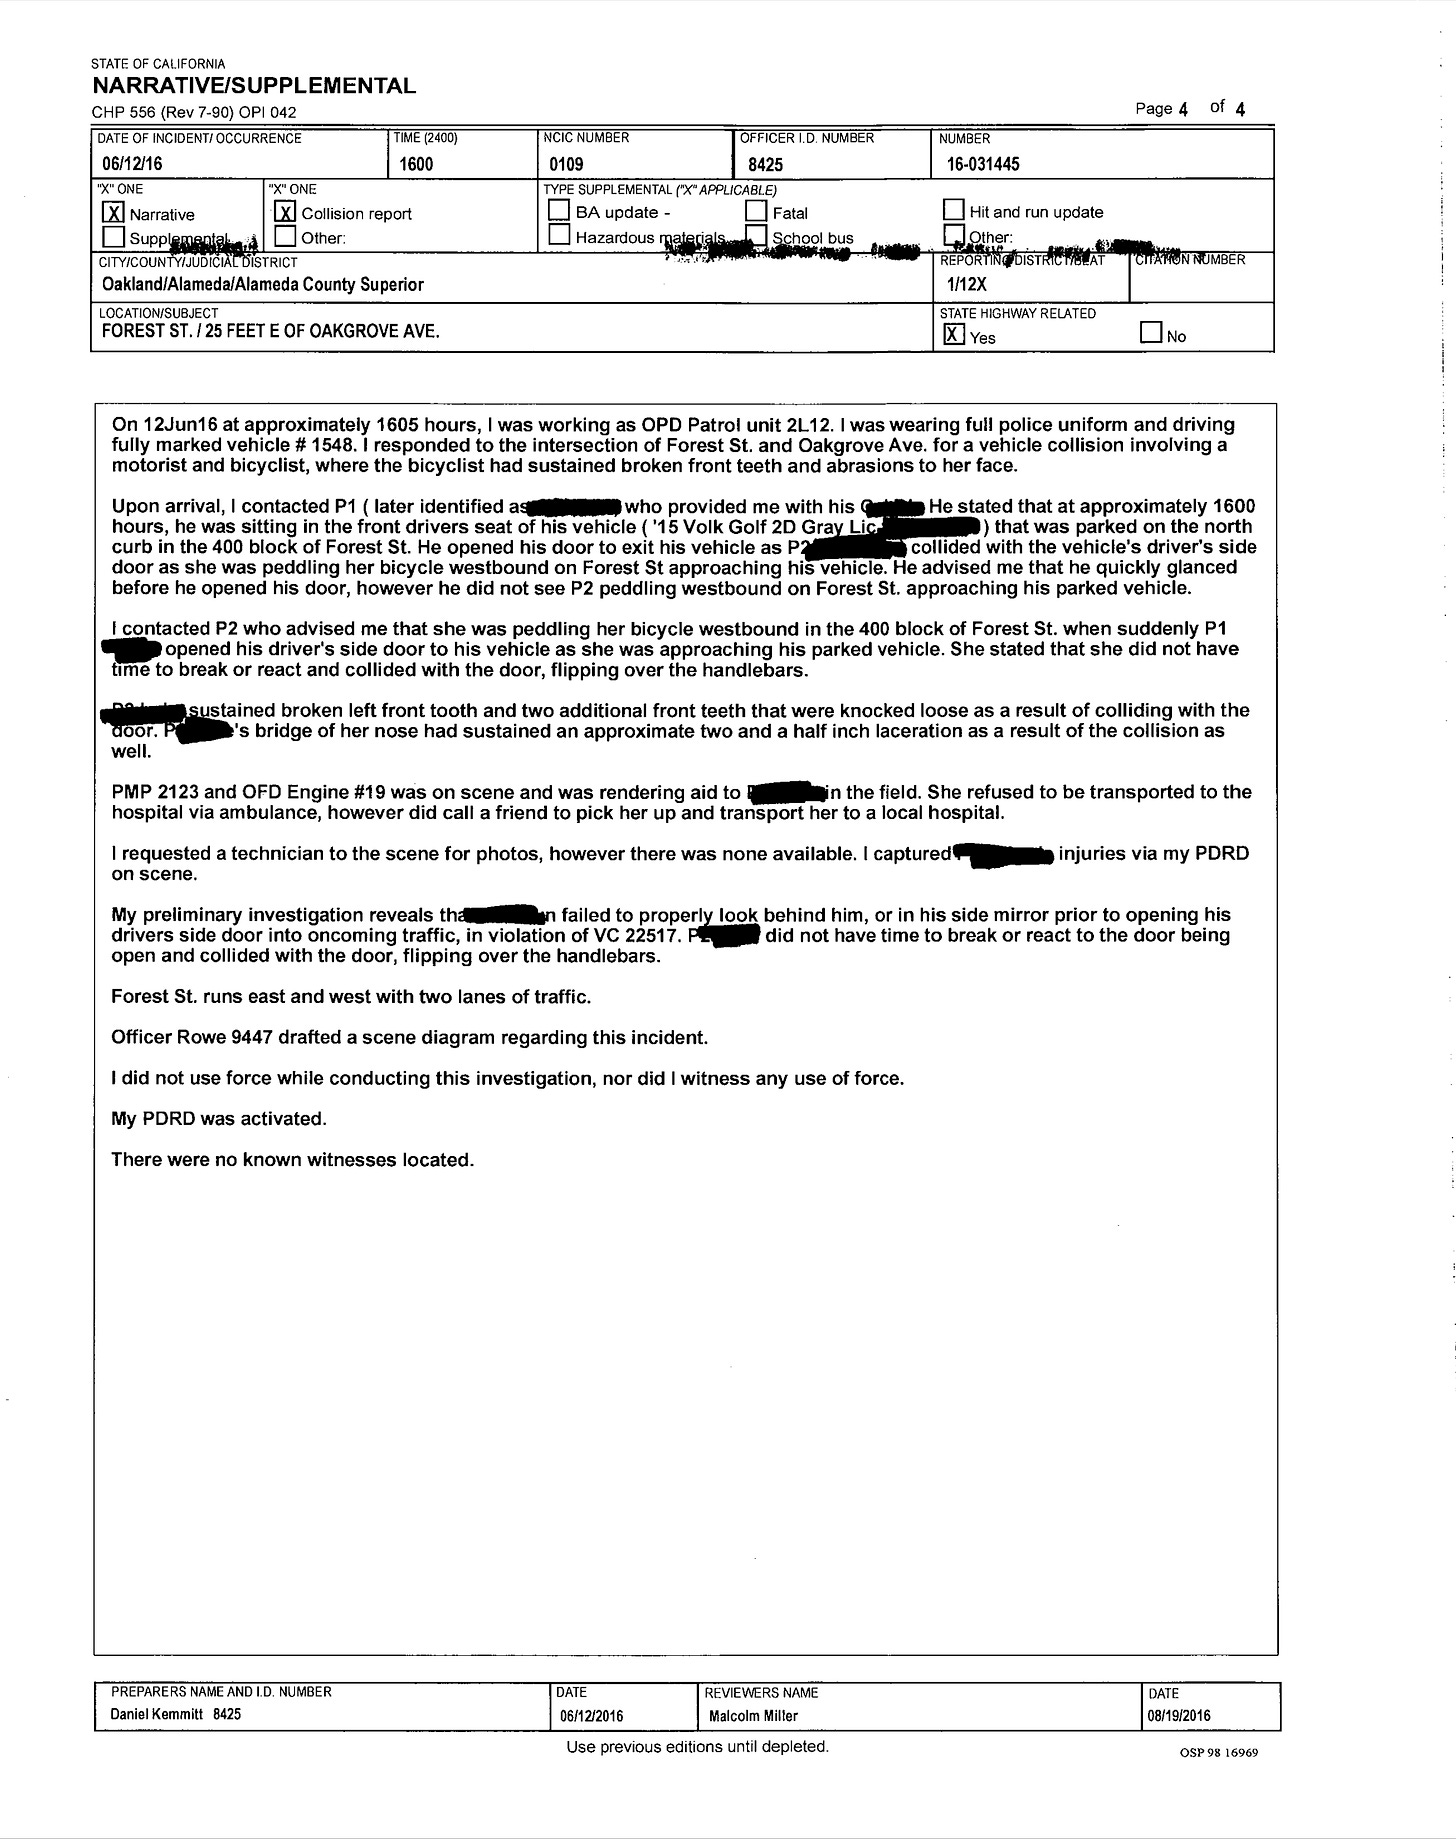
The report is the CHP 555 document, otherwise known as a Traffic Collision Report. These are supposed to be filled out anytime a law enforcement officer responds to a traffic collision regardless of the severity.
An actual copy of one of these reports is below.
They can be obtained via a public records request with the caveat that all personal information of the collision parties have to be removed. (Click/tap to enlarge)
(For those who glossed over the details, this is a dooring crash, one of hundreds that occurred across the region.)
Most of these data get coded and placed into SWITRS.
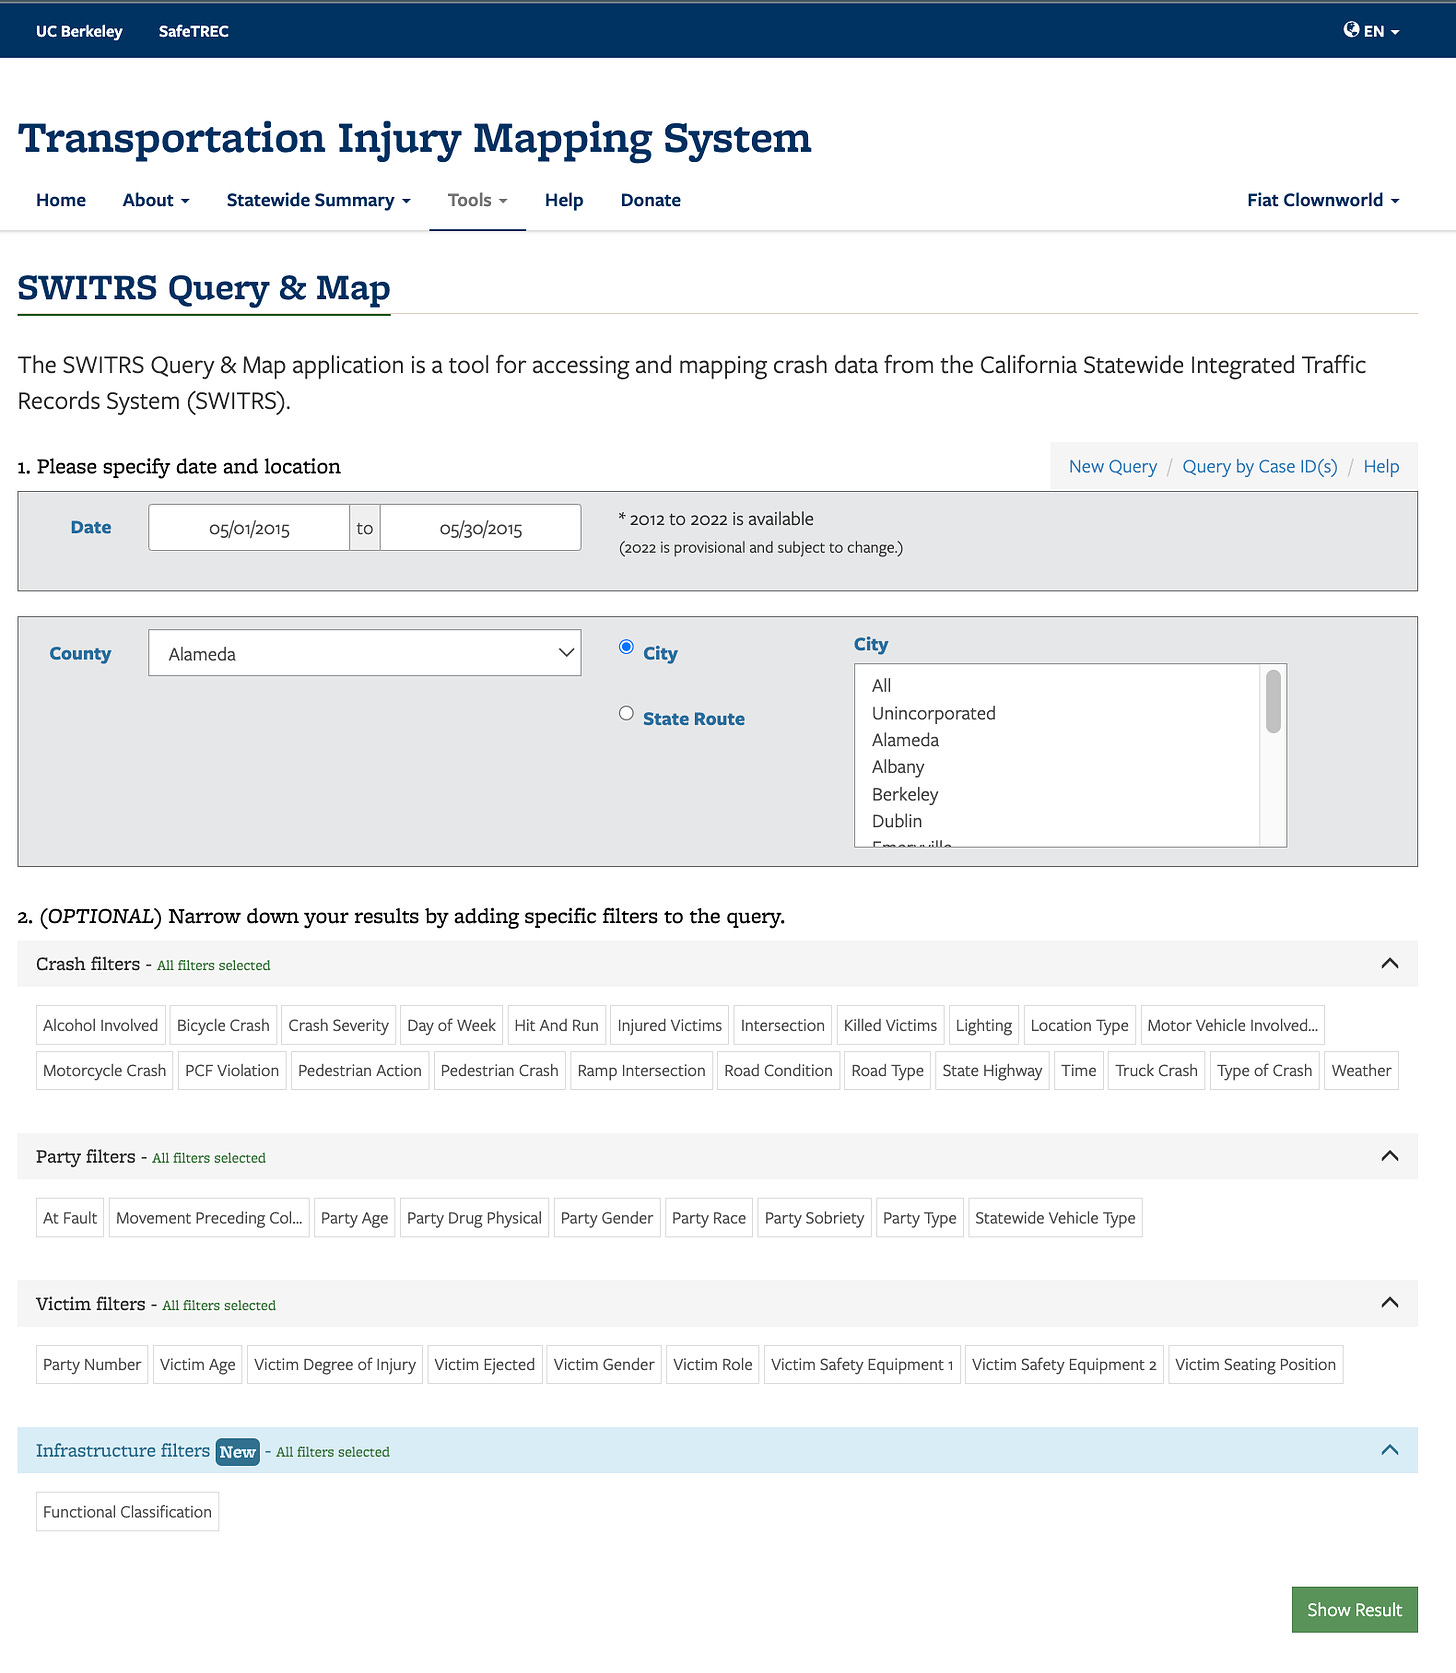
The SWITRS raw data are unfortunately difficult to decipher consisting of large CSV files that require some knowledge on the coding along with experience in databases. Fortunately, UC Berkeley’s Safe Transportation Research and Education Center (SafeTREC) have created a user-friendly front-end interface for people to view and analyze SWITRS called the Transportation Injury Mapping System or TIMS.
One tool in TIMS is the SWITRS Query & Map.
Using this tool, a user can specify a date range, location, and particulars of a crash.
For crashes that are geo-coded (apparently most reports are not yet assigned coordinates, and they’re hand-coded by TIMS volunteers!) the user can see a simple one-page summary.
Here’s the dooring crash from above.
The SWITRS Query & Map is also for looking at collision data from a broader point of view.
In other words, it can be used to confirm the claims made by these activist groups.
The San Diego County Bicycle Coalition claimed that between 2014 and 2021 that 300 cyclists and pedestrians were killed on the streets of the city of San Diego.
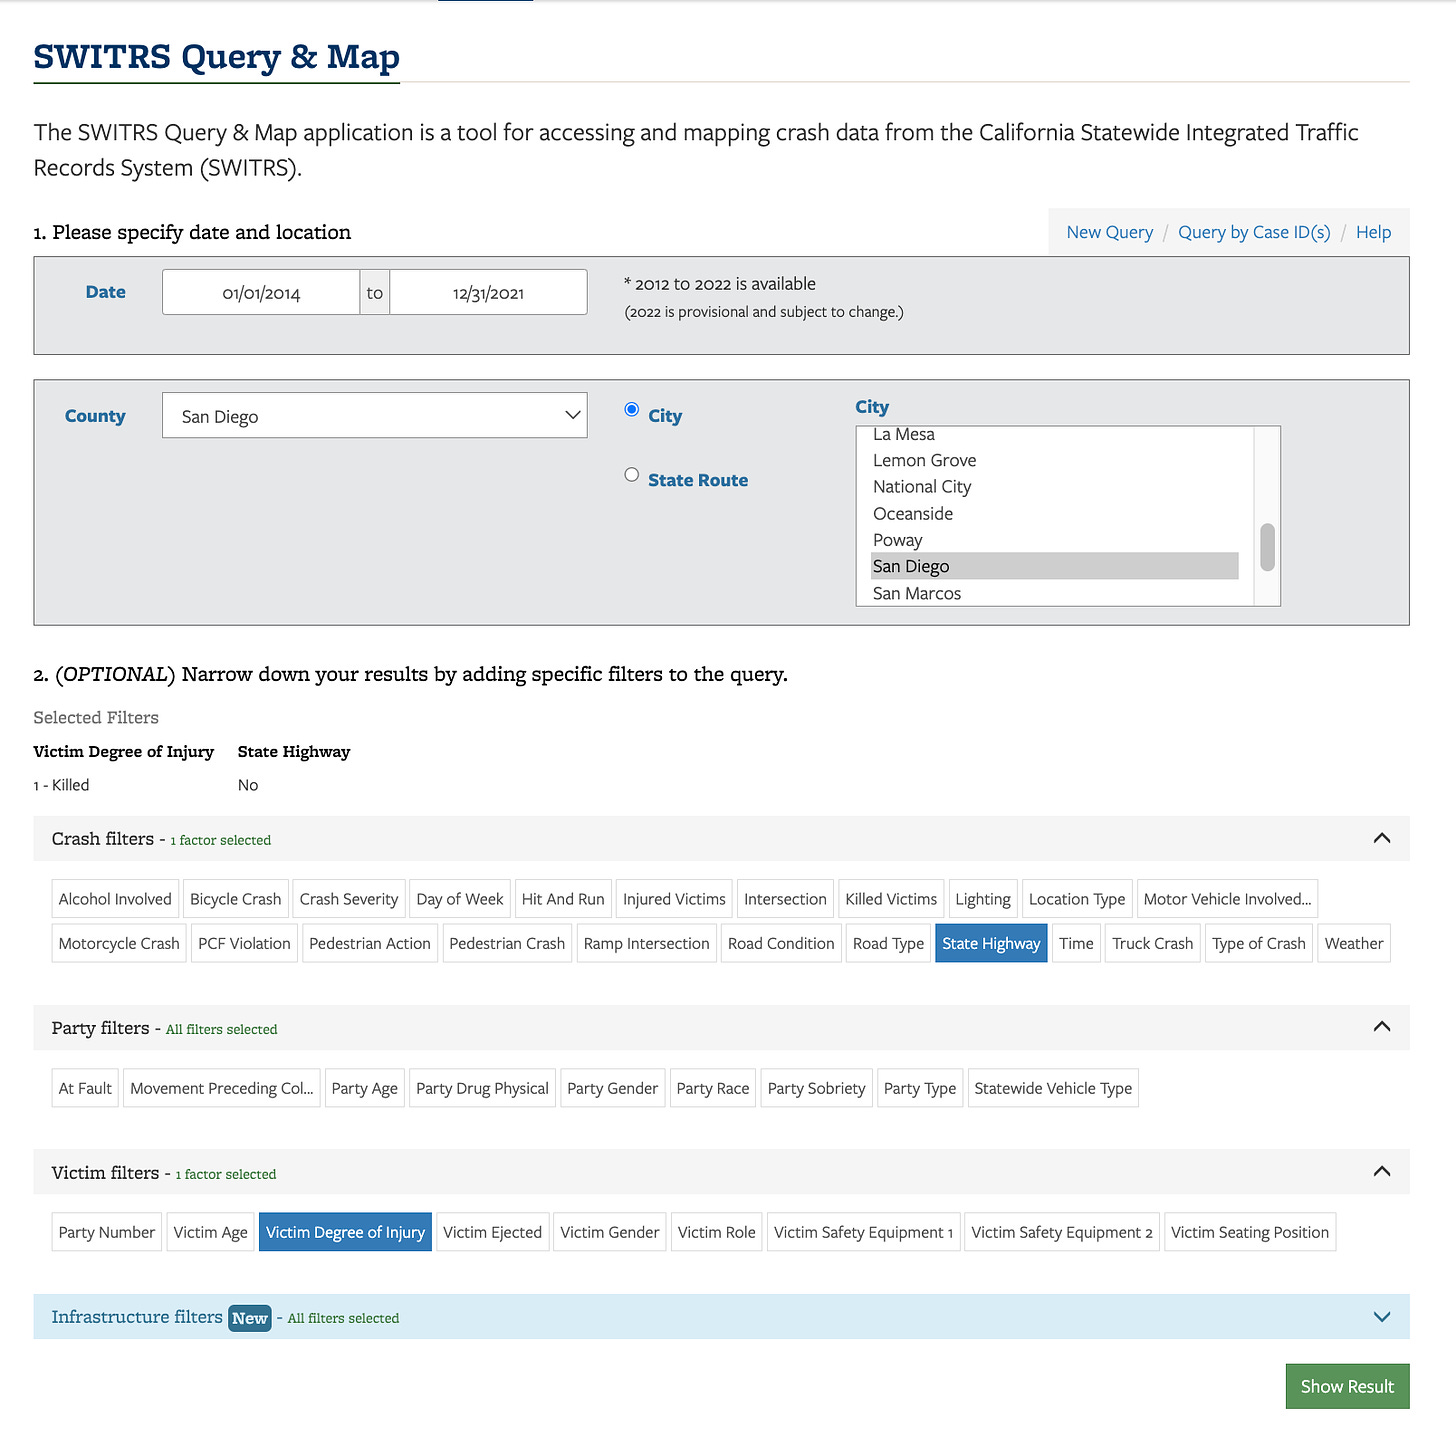
To check this figure, one needs to simply enter the following into the SWITRS Query & Map tool.
Date range: 01/01/2014 to 31/12/2021
Location: San Diego County, City of San Diego
State Highway: No1 (SEE FOOTNOTE)
Victim Degree of Injury: Killed
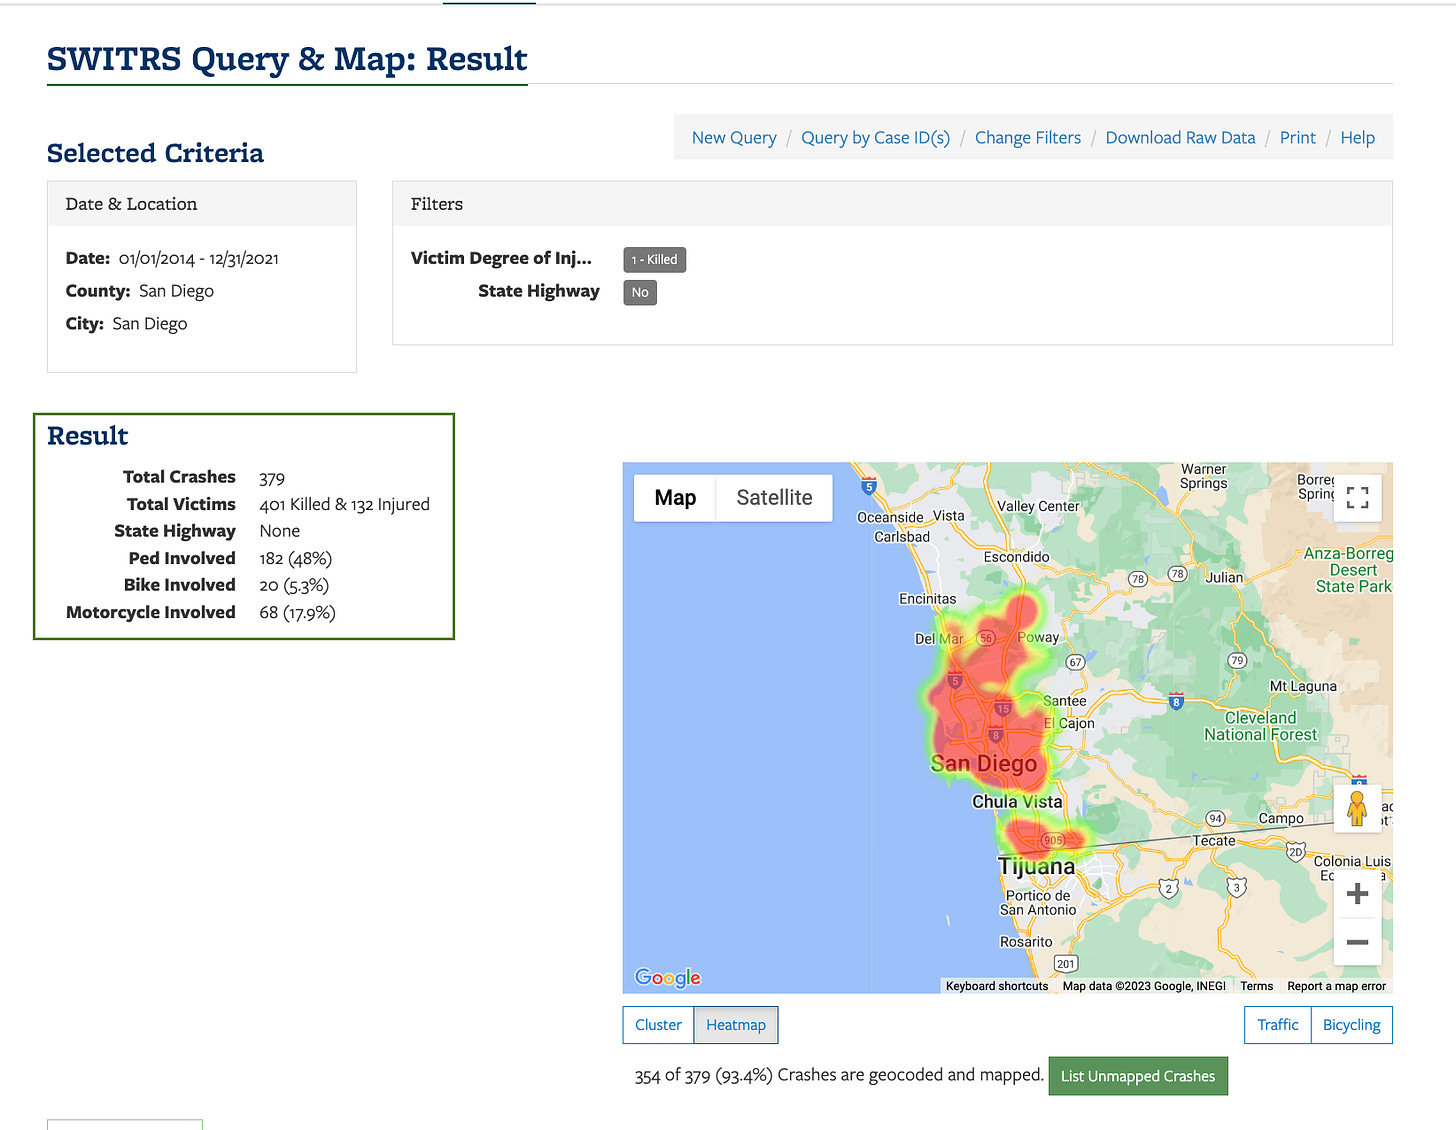
The results show 182 pedestrian fatalities and 20 bicycling ones for a total of 202, not 300.
Granular detail about the bicycling crashes is only available from looking at each individual crash but the Ped Crash Summary tab breaks the pedestrian fatalities further down.
It turns out almost half (43.41%+7.14%) of them are from pedestrians failing to yield to motor vehicles that already had the right of way. Furthermore, a good chunk of these fatalities were at night or in low light situations. In the so-called “progressive intersectional bicycle advocacy” (i.e. woke/racist) view pointing out such a fact would be victim blaming since the worldview of this crowd is that bicyclists people bicycling and pedestrians people walking are Noble Victims no matter what from traffic violence committed by people driving cars drivers.
But such accusations ignore objective reality and we’re getting off topic.
The joint-claim by Circulate SD and Families for Safe Streets can be verified too.
To recap, their claim differs slightly from the San Diego County Bicycle Coalitions. Their claim is that 283 pedestrians and bicyclists were killed on roads within the entire county of San Diego in the year 2022 alone.
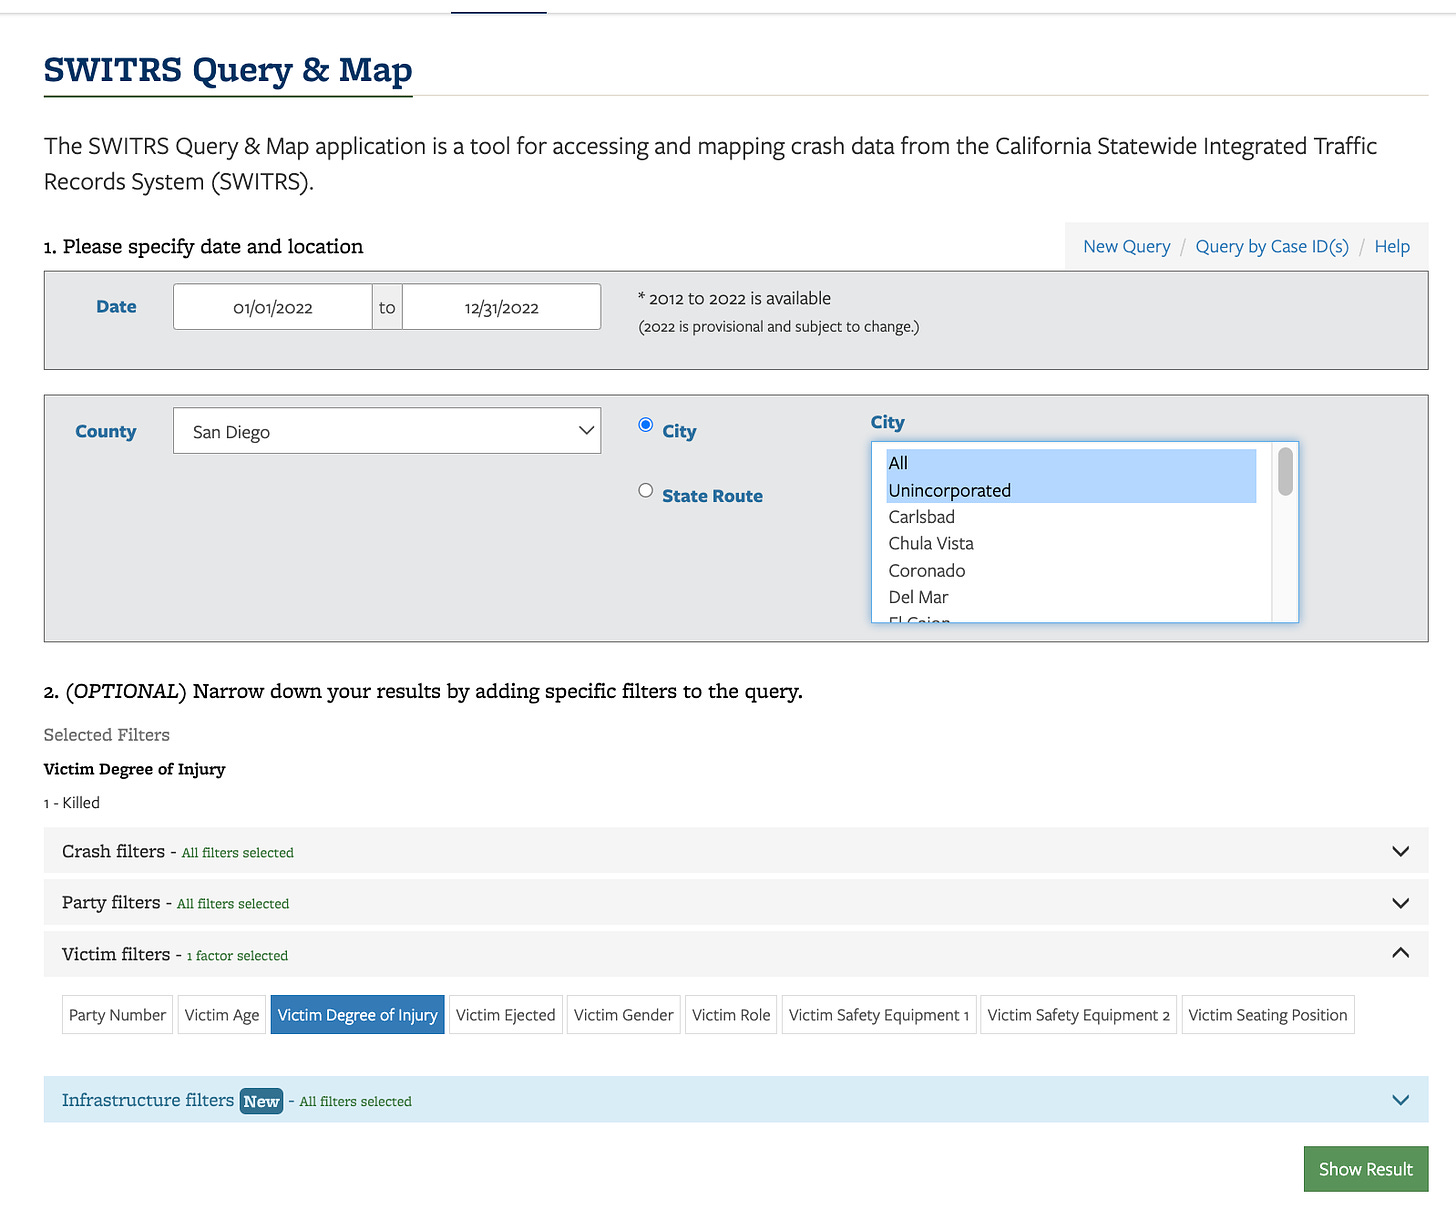
The criteria to input into the TIMS tool is as follows:
Date range: 01/01/2022 to 31/12/2022
County: San Diego
City: All
Victim Degree of Injury: Killed
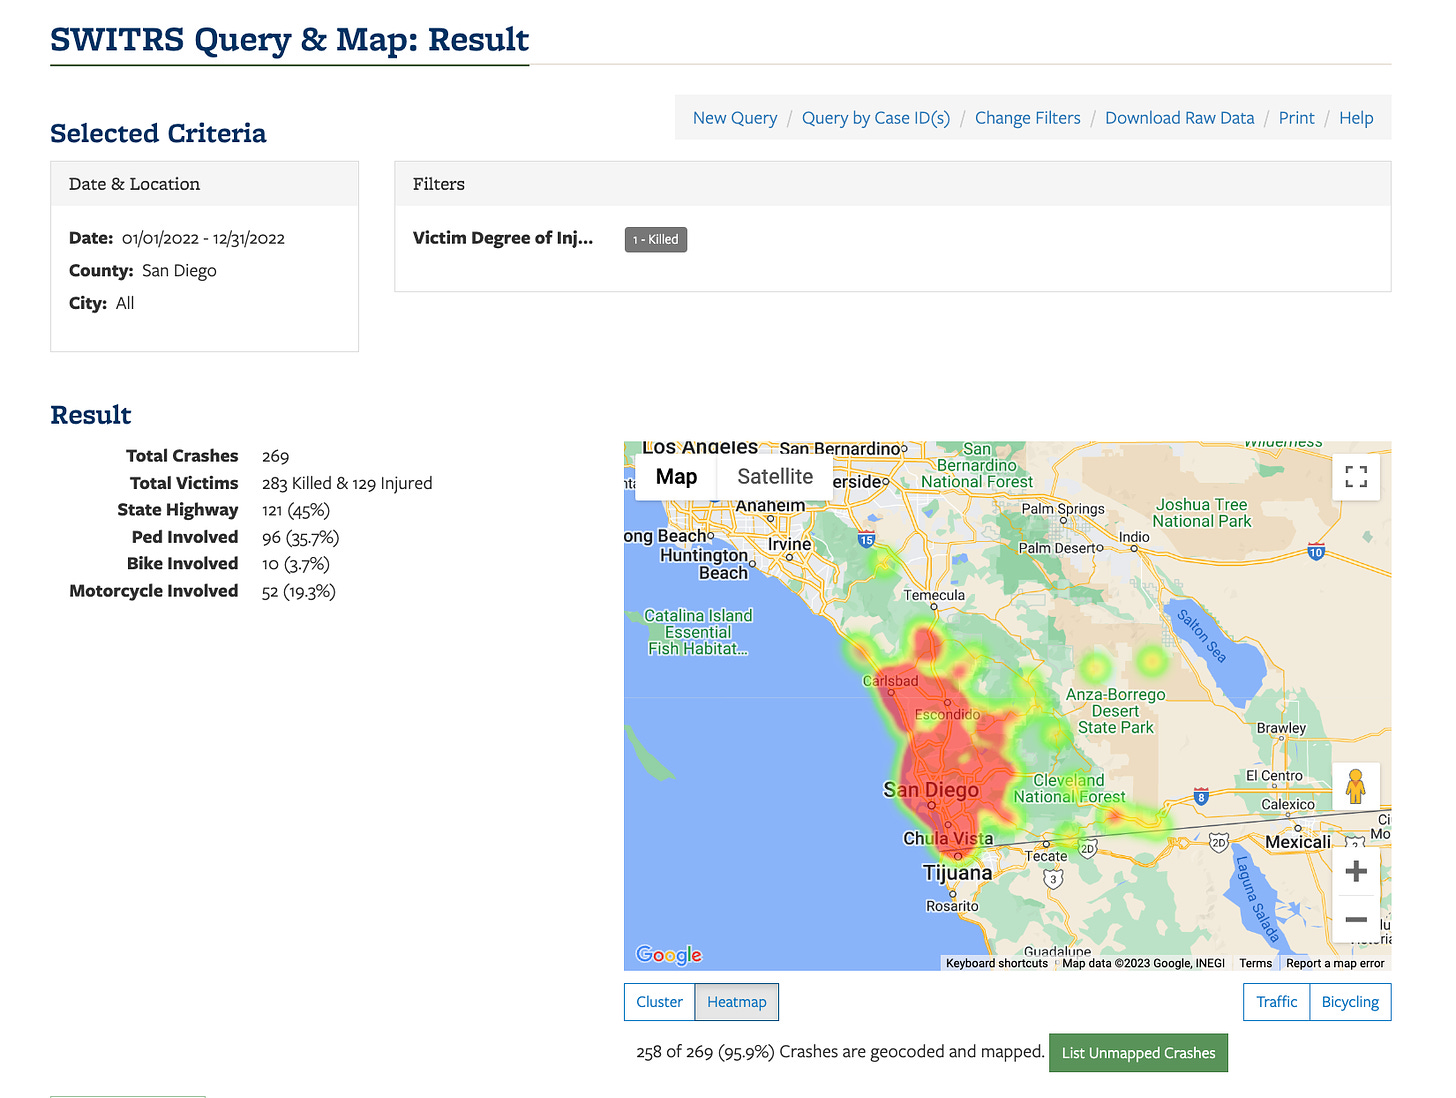
While it should be noted that 2022 data is, per TIMS, provisional, the figures provided by the activists are far off the provisional figures with 96 pedestrian fatalities and 10 bicyclist fatalities for a total of 106.
Their figure of 283 includes motor vehicle occupants.
To further add insult to injury, the incorrect figure was repeated by MacKenzie “more journalism, less bullshit” Elmer who is a reporter for the Voice of San Diego.
The State Highway system is owned and maintained by the California Department of Transportation (CalTrans), not the City. CA State Highways, and yes there are a ton of them, are listed one by one in the state’s Streets and Highways Code Section 300. Within the City of San Diego, nearly all roads belonging to the SHS are limited access freeways where pedestrian and cycling activity is prohibited. One caveat is the SHS does include crossings where pedestrians and cycling is permitted so long as it’s a city street, but even these crossings remain property of CalTrans - not the City. It’s on CalTrans to fix or improve these areas separate of what the city does on either side.


